
JVM
- Write your own Virtual Machine
- How to write a toy JVM
- JVM Anatomy Quarks
- Cliff Click @ VMSS16: Bits of Advice For the VM Writer (video)
- Best Books on the JVM? (hn)
- A JVM Assembler for the modern age
- JVM Anatomy Quarks (Book)
TODO review old devops notes below
- Things you need to know about JVM (that matter in Scala) by Mateusz Kubuszok (Book)
- Speeding up compilation time with scalac-profiling
- Java Memory Management (Course)
- Multithreading and Parallel Computing in Java (Course)
- scalac options
- GraalVM
- The Java Virtual Machine
- JVM Stacks and Stack Frames
- volatile
- compare and swap
- javap
- diamond inheritance problem
- strong, soft, weak, phantom references
- What Every Computer Scientist Should Know About Floating-Point Arithmetic
Java Memory Management
Resources
- Java Language and Virtual Machine Specifications
- The Java HotSpot Performance Engine Architecture
- Memory Management in the Java HotSpot Virtual Machine
- JVM Architecture 101
- Inside the Java Virtual Machine
- JVM Internals
- Java Code to Byte Code
- Understanding JVM Internals
- Understanding Java Garbage Collection
- Java Decompiler
- Java Concurrency in Practice (Book)
- Most Important JVM Parameters
- JVM Garbage Collectors
- Statistically Rigorous Java Performance Evaluation (Paper)
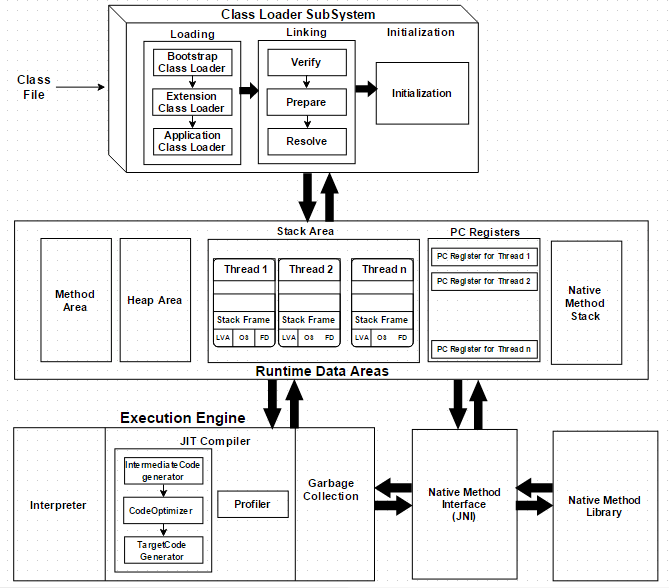
Stack
The Stack is a First-In-Last-Out data structure managed by the JVM i.e. push to the top, pull or pop from the top. Every thread has its own Stack and data can be seen only by that thread
Each time you call a function, Java pushes the local variables for that function onto the Stack. A copy of the value is passed to the methods. When the method returns, all the data are popped or pulled from the Stack
When you reach a closing curly bracket (not only after a return) any local variables declared inside the block you are leaving is popped from the Stack and destroyed, this is how scope works
Heap
The Heap allows to store data that has a longer lifetime than a single code block or function e.g. objects that need to be shared across multiple methods
All the memory in the JVM is mainly Heap, is massive compared with the Stack and there is only one Heap shared across all the threads and a number of Stacks (each thread has its own Stack)
Variables
How variable are store in Java:
- objects are stored physically on the Heap
- variables are reference to objects
- local variables are stored on the Stack
- primitive variables resides entirely on the Stack
int age = 30
String name = "niqdev"

Stack          Heap
[  name* ] --> [ "niqdev" ]
[  age   ]
In Java, variable can only be passed by values i.e. a new variable is added on the Stack
Passing by reference is not possible, but don't confuse that when objects are passed into methods, the reference of the object is passed by value
final keyword means that the value can only be assigned once (can be assigned later), but we can change the value referenced by the object. Lack of const correctness in Java: const unfortunately is a reserved keyword and cannot be used, but allows to freeze the whole state of the object internally: mutable states are bad!
Example
final Customer c = new Customer("a")
// or
final Customer c
c = new Customer("a")

// this is NOT allowed - compiler error
c = new Customer("b")
// but this yes
c.setName("b")
String
As a general rule of thumb, all objects are stored on the Heap and only references are stored in the Stack. In reality the JVM for optimization maybe store some objects also in the Stack, but this is not visibile. Strings are immutable and if "short" are stored in a pool on the Heap to be reused.
When you create a new string with quotes e.g. "hello", the JVM creates and retrieve the string from a constant pool. To create a new object every time use the new String("hello"). To force a lookup in the pool use intern(). Use == to compare the reference (address in memory)
String s1 = "hello";
String s2 = "hello";
String s3 = new String("hello");
String s4 = new String("hello").intern();

// true - 2 strings created using quotes refer to the same object
System.out.println(s1 == s2);
// false - if you create a string using new operator
// it's not part of the constant pool, so objects are different
System.out.println(s1 == s3);
// true - if you call intern() method Java adds current string to the string pool
// and 2 string become the same object
System.out.println(s1 == s4);
Garbage collection
Garbage collection (invented in lisp around 1959) removes object no more referenced on the Heap from the Stack. Most of the objects don't live for long, if an object survives it is likely to live forever. Mark and sweep is the algorithm used:
- instead of look for all the objects that must be removed, it looks for the object that need to be retained
- all the threads in the application are paused (stop the world event)
- follow all the references from the Stack and mark it as alive
- full scan on all the Heap and wipe unmarked references
- reorder contiguos memory in order to avoid fragmentation
- it's faster if more objects need to be cleaned because it looks only for what need to be retained
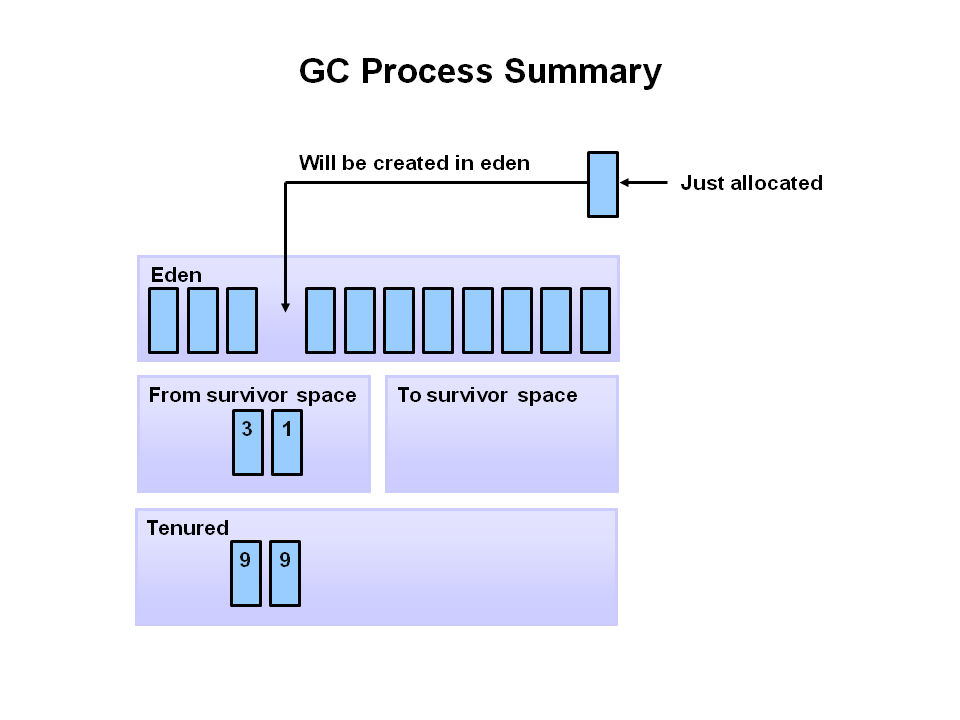
Generational garbage collection is a way to organize the Heap into 2 sections to try to avoid freeze the application while garbage collecting the whole Heap:
young generation is small, so it requires only few fraction of seconds to be scanned
old generation also called Tenured, isn't scanned usually, only if needed i.e. when it's full and requires few seconds
young generation is divided in Eden, Survivor0 and Survivor1
new objects are created in the Eden
when Eden gets full, objects are moved in the Survivor space and moved amongs the two alternatively to be compacted
memory is reserved in the Heap for S0 and S1 even if not used
after an object survived 8 generations (default), movement and compaction between Survivor GC, then is stored in the old generation
VM can change the number of generations based on the amount of memory available
class variables (static variables) are stored as part of the class object associated with that class and stored in the Permanent Generation (PermGen) prior Java 8 or in the MetaSpace
Run jvisualvm and add Visual GC plugin
Any object on the Heap which cannot be reached through a reference from the Stack is eligible for garbage collection. Memory leak are objects that are not free on the Heap and continue to consume memory after a program finish. Memory leaks are difficult to find and the JVM try to avoid them running the garbage collector. Soft leak happens when an object is referenced on the Stack even thought it will never be used again
You can not clear memory, with Runtime.getRuntime().gc() or System.gc() you can only suggest JVM to run garbage collection, but there is no guarentee. In general, you should never invoke gc() directly. While it is running the application is temporarily suspended and it will pause all the threads. finalize() is invoked when an object is garbage collected, but there is absolutely no guarentee if and when it will happen.
Is useful to check for example memory leak, as warning, if some resources were not closed properly
PermGen and Metaspace
Permanent Generation (Heap memory) since Java 6 contains objects that will never garbage collected:
- string pool is in PermGen
- class metadata are stored in PermGen
If the PermGen run out of space the only solution is to increase the size of memory, otherwise the app will crash. In Java 7 String Pool was moved in the old memory and therefore string can be garbage collected now. In Java 8 MetaSpace replaced PermGen as separeted memory allocated, which is not part of the Heap anymore and is the total available memory
Tuning
# set the maximum heap size to 512 MB
-Xmx512m
# set the starting heap size to 150 MB
-Xms150m
# set the size of the PermGen to 256 MB (PermGen was removed in Java 8)
-XX:MaxPermSize=256M
# set the size of the young generation to 256 MB
# young generation by default is 1/3 of the max heap size (suggestion between 1/2-1/4)
-Xmn256m
Oracle JVM has 3 types of garbage collector, it doesn't matter how many threads, the application will be paused anyway:
# serial uses a single thread to perform gc
-XX:+UseSerailGC
# parallel performs gc on young generation in parallel
-XX:+UseParallelGC
# mostly concurrent, closest to real time gc pausing only when marking
# try to minimize the "stop of the world"
-XX:+UseConcMarkSweepGC
-XX:+UseG1GC
Debugging
# print to console when a garbage collection takes place
-verbose:gc
# creates a heap dump file if app crash
-XX:HeapDumpOnOutOfMemory
# to find default garbage collector on the machine
-XX:+PrintCommandLineFlags
Parameters are case sensitive
Weak and Soft references
References from the Stack to the Heap
- Strong references are always marked as alive (default)
- Soft references are eligible for garbage collection only if the JVM run out of memory
- Weak references are always eligible for garbage collection and is up to the JVM to retain it or not
WeakReference<T> and SoftReference<T> are useful for caching scenario, when a reference on the Heap is GC, then the variable in the stack became null. In a WeakHashMap for example, the reference from the stack to the map in the Heap is strong, but the references to key/value pair are eligible for GC, in that case both key and value are removed
Perfomance
Resources
- HdrHistogram
- Understanding JIT compiler
- Understanding Java JIT Compilation with JITWatch
- Coordinated Omission
- Java Flight Recorder
- Safepoints in HotSpot JVM
- Java Mission Control (JMC) and Flight Recorder (JFR)
- JMH and sbt-jmh
- What is JMX? and Jolokia
Latency describes the amount of time that it takes for an observed process to be completed
Throughput defines the observed rate at which a process is completed
A bottleneck refers to the slowest part of the system
A common mistake is to rely on averages to measure the performance of a system because it is a lossy summary statistic. A percentile is a measurement indicating the value below which a given percentage of observations in a group of observations fall
Benchmarks are a black-box kind of measurement. Benchmarks assess a whole system's performance by submitting various kinds of load as input and measuring latency and throughput as system outputs
A profiler enables white-box testing to help you identify bottlenecks by capturing the execution time and resource consumption of each part of your program. Most profilers instrument the code under observation, either at compile time or runtime, to inject counters and profiling components. This instrumentation imposes a runtime cost that degrades system throughput and latency
The coordinated omission problem happen we you measure the time required to process a command without taking into account the time the command had to wait to be processed
Java Flight Recorder (JFR) is a tool for collecting, diagnosing, and profiling data about a running Java application. It is integrated into the Java Virtual Machine and causes almost no performance overhead and is able to access data outside of JVM safepoints. Safepoints are necessary to coordinate global JVM activities, including stop-the-world garbage collection
Java Mission Control (JMC) allows to connect to a running Java application via JMX and capture runtime information from the Flight Recorder (JFR), executing commands via JMX or displaying reports from JFR sessions
The Just-In-Time (JIT) compiler is a component of the Java Runtime Environment that improves the performance of Java applications at run time. Java programs consists of classes, which contain platform neutral bytecode that can be interpreted by a JVM on many different computer architectures. At run time, the JVM loads the class files, determines the semantics of each individual bytecode, and performs the appropriate computation. The additional processor and memory usage during interpretation means that a Java application performs more slowly than a native application. The JIT compiler helps improve the performance of Java programs by compiling bytecode into native machine code at run time
Scala
# compiles
scalac miscellaneous/scala-example.scala -d miscellaneous/

# lists compiler phases
scalac -Xshow-phases

# prints for-comprehensions desugared
scalac -Xprint:parse miscellaneous/scala-example.scala -d miscellaneous/

# prints all phases
scalac -Xprint:all miscellaneous/scala-example.scala -d miscellaneous/

# shows bytecode
javap -v miscellaneous/Example$.class
// scala-example.scala
object Example {
  def helloFor =
    for {
      i <- List(1, 2, 3, 4)
      j <- List(3, 4, 5, 6)
      if i == j
    } yield i
}